
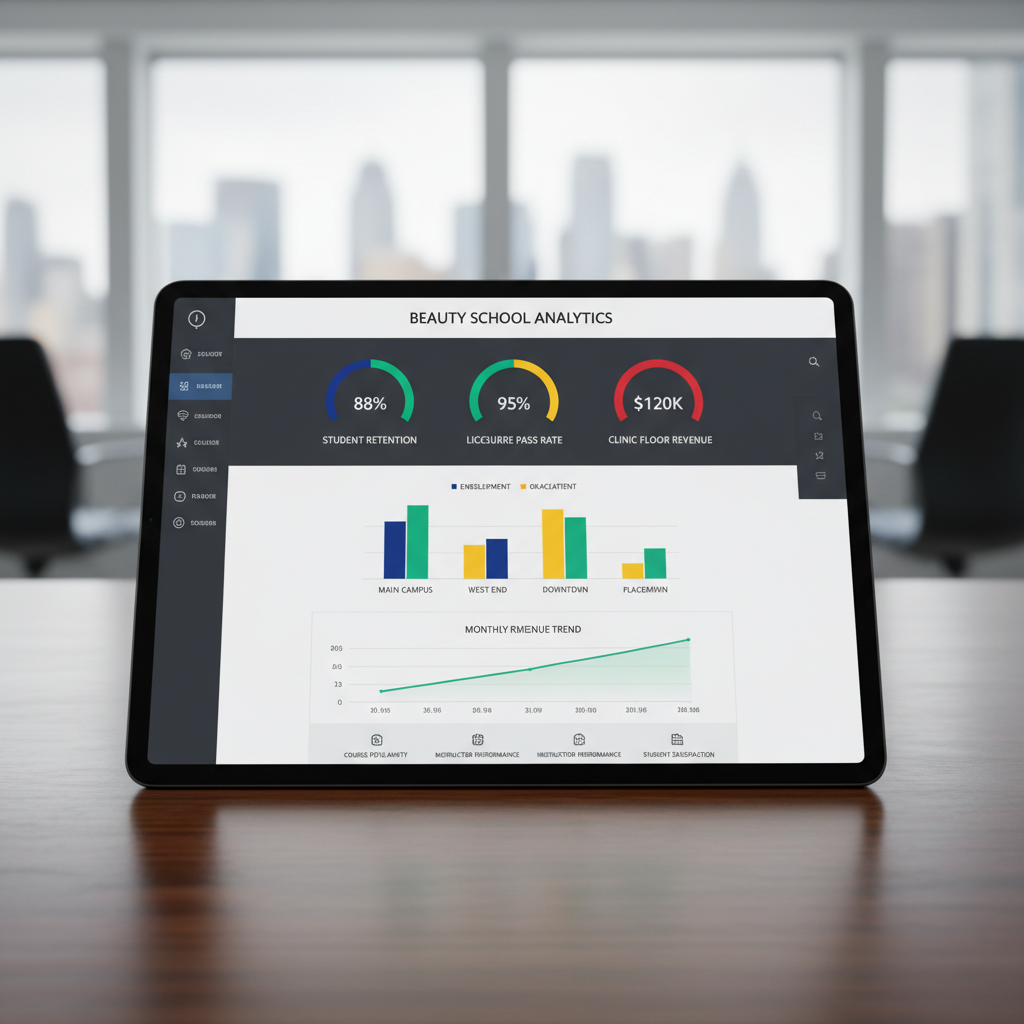
Key Metrics for Tracking Multi-Campus Beauty School Performance
Move beyond vanity metrics like enrollment. Discover the key performance indicators that drive real growth, improve student outcomes, and standardize success across all your beauty school campuses. Learn from our real-world experience.
For multi-campus beauty school owners, growth often brings complexity. What works at one location may not translate to another, and without consistent data, you're left managing with intuition rather than insight. The core problem isn't a lack of information; it's an abundance of the wrong information, spread across siloed spreadsheets and disparate systems. This makes it nearly impossible to answer a fundamental question: Are all our campuses truly performing at their peak?
In today's competitive landscape, understanding the metrics that matter and how beauty schools can track performance across campuses is no longer optional. It's the foundation for scalable growth, academic excellence, and operational efficiency. By shifting focus from simple enrollment numbers to holistic performance indicators, owners can drive better student outcomes, optimize resource allocation, and build a more resilient and profitable organization. As specialists who have built custom performance dashboards for multi-location schools, we've seen firsthand that a data-driven approach transforms reactive problem-solving into proactive strategy, unlocking the full potential of every campus.
What Is Beauty School Performance Tracking?
Beauty school performance tracking is the systematic process of collecting, analyzing, and reporting on key data points related to student outcomes, operational efficiency, and financial health. It involves monitoring specific metrics to evaluate success, identify areas for improvement, and ensure consistency across single or multiple campus locations.
What Metrics Actually Indicate Success in a Beauty School?
A. Direct Answer: True success metrics extend far beyond enrollment figures to include student retention rate, on-time graduation rate, state board licensure pass rate, and post-graduation job placement rate. These KPIs measure the actual quality and impact of your educational programs.
B. Expanded Explanation: For decades, many schools have equated a full admissions pipeline with success. While enrollment is essential for revenue, it's a vanity metric—it tells you about your marketing effectiveness but reveals nothing about your educational delivery or student satisfaction. True, sustainable success is reflected in what happens *after* a student enrolls. High retention rates indicate a positive, supportive learning environment where students feel engaged and valued. On-time graduation rates demonstrate that your curriculum and scheduling are effective at guiding students toward their goals without costly delays.
The two most critical impact metrics are licensure pass rates and job placement. A high pass rate on the state board exam is the ultimate proof that your curriculum is effective and your instructors are preparing students for professional success. It is a direct reflection of your core product: education. Following that, a strong job placement rate provides the ultimate ROI for your students, justifying their investment of time and money and turning them into powerful advocates for your brand. Focusing on these metrics shifts your school’s priority from simply filling seats to creating successful, licensed professionals.
C. Table: Vanity Metrics vs. Impact Metrics
| Vanity Metric (Measures Activity) | Impact Metric (Measures Outcome) |
|---|---|
| Total Enrollment Numbers | Student Retention Rate |
| Number of Website Visits | On-Time Graduation Rate |
| Social Media Followers | State Board Licensure Pass Rate |
| Total Applications Received | Post-Graduation Job Placement Rate |
How Can Multi-Campus Beauty Schools Standardize Performance Tracking?
A. Direct Answer: Standardization is achieved through a centralized data system, uniform KPI definitions for all locations, and consistent reporting schedules. This framework ensures that every campus is measured fairly and accurately against the same high-performance benchmarks.
B. Expanded Explanation: The number one challenge for multi-campus operators is the "apples to oranges" comparison. One campus manager tracks attendance in a Google Sheet, another uses a custom Excel file, and a third relies on paper records. This chaos of data silos makes a true, holistic view of the organization impossible. Standardization is the cure. It begins with establishing a single source of truth—typically a centralized beauty school management software or a custom-built platform. This system becomes the sole repository for all critical data, from admissions to graduation.
From our experience building a custom app for a three-campus school, we discovered that one location defined "present" as being in the building, while another only counted students who clocked in for a specific class. This simple discrepancy skewed retention and progress reports. To solve this, we helped them create a "KPI Dictionary" that explicitly defined every single metric. "Attendance Rate," for example, was defined as "the percentage of scheduled class hours a student has clocked into via the official system." This level of clarity is non-negotiable. Finally, implementing a regular reporting cadence—daily for operational metrics, weekly for student progress, and monthly for financial review—ensures everyone from instructors to C-level executives is working with the same timely information.
C. Steps to Standardize Multi-Campus Tracking
- Establish a Data Governance Lead: Appoint one person or a small committee responsible for owning data integrity and standardization across the organization.
- Define Universal KPIs: Collaboratively create a KPI dictionary that provides a precise, unambiguous definition for every metric you will track. Get buy-in from all campus directors.
- Select a Centralized Technology Platform: Invest in a Student Information System (SIS) or other management software that can serve all campuses from a single database. This is the backbone of standardization.
- Train All Staff Uniformly: Ensure every administrator and instructor across all locations is trained on how to use the system and interpret the data in the same way.
- Implement a Regular Review Cycle: Schedule recurring meetings (weekly, monthly, quarterly) to review the standardized reports, discuss performance, and share best practices between campuses.
Which KPIs Help Improve Student Retention, Graduation, and Licensing?
A. Direct Answer: The most effective KPIs are leading indicators that signal potential issues early. These include student attendance and tardiness rates, Satisfactory Academic Progress (SAP) status, clinic floor service hours, and student satisfaction scores.
B. Expanded Explanation: Waiting for a student to drop out to analyze the problem is too late. The key is to track leading indicators that predict future outcomes. A sudden drop in a student's attendance, for example, is one of the strongest predictors of disengagement and potential withdrawal. By tracking this daily, staff can intervene immediately with a supportive phone call or meeting to address the underlying issue, whether it's personal, financial, or academic.
Satisfactory Academic Progress (SAP) is another crucial KPI. This isn't just about final grades; it's about tracking progress on theory tests, practical evaluations, and completed hours against the school’s required timeline. A student falling behind in SAP is a clear red flag that they need academic support to get back on track for on-time graduation. Similarly, monitoring clinic floor service and practical hours ensures students are meeting the state board's hands-on requirements for licensure. If a student's practical hours lag significantly behind their theory hours, it signals a potential bottleneck that could delay their graduation and exam eligibility. Proactively managing these metrics turns your team from reactive problem-solvers into proactive student success coaches.
C. Key Leading Indicators for Student Success
- Attendance & Tardiness Rate: The most immediate indicator of student engagement. Automated tracking can flag students who drop below a certain threshold (e.g., 90% attendance) for immediate follow-up.
- Satisfactory Academic Progress (SAP): Monitors whether students are passing exams and completing practicals at a pace to graduate on time. This is a core compliance and success metric.
- Student Satisfaction (NPS): Regular, simple surveys (e.g., "On a scale of 1-10, how likely are you to recommend our school?") can capture sentiment and identify systemic issues before they lead to withdrawals.
- Clinic Floor Hour Completion: Tracks progress toward the hands-on hours required for licensure. Lagging progress here directly jeopardizes graduation and licensing timelines.
- Theory vs. Practical Hour Balance: Ensures students are getting a well-rounded education and not falling behind in one critical area, which is vital for exam preparation.
How Can Beauty Schools Use Data to Improve Operations and Instructor Performance?
A. Direct Answer: Data enables schools to optimize clinic floor inventory based on service trends, refine class schedules using attendance patterns, and evaluate instructor effectiveness through metrics like cohort pass rates and student feedback, fostering professional development.
B. Expanded Explanation: A data-driven approach transforms every aspect of school operations from guesswork to science. On the clinic floor, for instance, instead of blindly reordering products, you can analyze service data to see which treatments are most popular on which days. This allows for smarter inventory management, reducing waste and ensuring you always have high-demand products in stock. You can also use appointment data to optimize staffing schedules, ensuring you have enough student practitioners and supervising instructors during peak client hours.
When it comes to instructor performance, data provides an objective foundation for coaching and development. Rather than relying on subjective observation, you can look at an instructor's specific student outcomes. Do their students consistently score higher on practical exams? Does their cohort have a higher-than-average licensure pass rate? This information isn't for punishment; it's for identifying excellence. A top-performing instructor can be tasked with mentoring others, sharing their successful teaching methods across campuses. Conversely, if an instructor's students are struggling in a specific area, it provides a clear, data-backed opportunity for targeted training and support. This creates a culture of continuous improvement for both staff and students.
C. Checklist: Data-Driven School Operations
- [ ] Inventory Optimization: Review monthly clinic service reports to adjust product purchasing and minimize waste.
- [ ] Retail Sales Training: Track retail-sales-per-student-practitioner to identify who needs more sales training and who excels.
- [ ] Schedule Efficiency: Analyze class attendance data by time of day and day of the week to optimize future course scheduling.
- [ ] Instructor Mentorship: Compare cohort-specific licensure pass rates to identify high-performing instructors who can mentor their peers.
- [ ] Curriculum Refinement: Analyze theory exam data to pinpoint specific topics or chapters where students consistently underperform, indicating a need to update teaching materials.
What Role Does Technology Play in Simplifying and Centralizing Reporting?
A. Direct Answer: Technology, such as specialized beauty school management software or custom-built platforms, automates data collection, consolidates it into a single database, and generates real-time dashboards. This eliminates manual errors and provides school owners with instant, accurate, enterprise-wide reporting.
B. Expanded Explanation: Technology is the engine that powers modern performance tracking. The alternative—manual data entry into spreadsheets—is slow, arduous, and dangerously prone to human error. A single typo can skew an entire report, leading to flawed decisions. Furthermore, by the time an administrator has manually compiled reports from three different campuses, the information is already days or weeks old and effectively useless for immediate action.
Centralized technology platforms solve these problems. They automate data capture at the source, whether it's a student clocking in on a tablet, a transaction on the clinic floor POS system, or a grade entered by an instructor. This information feeds directly into a central database, creating a single source of truth. The most powerful feature of these systems is the dashboard. For a multi-campus owner, this means logging in and instantly seeing a high-level overview of all locations. You can view side-by-side comparisons of retention rates, revenue, and licensure pass rates in real-time. In the custom solution we developed, this visibility saved the administrative team over 15 hours per week on manual reporting and empowered the owner to make strategic decisions with confidence, knowing the data was always current and correct.
C. Table: Manual Reporting vs. Centralized Technology
| Feature | Manual Process (Spreadsheets) | Centralized System (Software) |
|---|---|---|
| Data Accuracy | High risk of human error in entry and formulas. | High accuracy through automated data capture. |
| Timeliness | Reports are delayed, reflecting past performance. | Real-time data available instantly on dashboards. |
| Scalability | Becomes exponentially more complex with each new campus. | Easily scales to accommodate new locations and users. |
| Accessibility | Information is siloed in different files and computers. | One secure, web-based login for all authorized users. |
Why We Are Leaders in Beauty School Analytics
Our expertise isn't theoretical; it's forged from hands-on experience solving the very challenges this article describes. We partnered with a multi-campus beauty school that was struggling with the exact issues of data fragmentation and inconsistent tracking across its three locations. They had dedicated leaders at each campus but no unified way to measure success, share insights, or make informed, enterprise-level decisions. Their growth was stalled by operational inefficiency.
In response, we didn't just offer advice; we rolled up our sleeves and built a solution. We designed and implemented a bespoke web application tailored to the unique operational flow of a cosmetology school. This platform centralized every critical metric—enrollment pipelines, student attendance, SAP status, clinic floor service hours, retail performance, and progress toward licensure—into a single, real-time dashboard. The result was transformative. We replaced dozens of disconnected spreadsheets with one source of truth.
This deep dive gave us an unparalleled understanding of the industry's nuances. We know the importance of tracking practical hours for state board compliance and the impact of clinic floor retail on the bottom line. We have seen firsthand how centralized data empowers owners to move from putting out fires to strategically planning for the future. Our insights are based on real-world implementation and the measurable success of a growing, data-driven beauty school.
How Businesses Use Beauty School Performance Tracking Today
School owners and directors are leveraging centralized data in highly practical ways to drive growth and efficiency. Here are several common use cases:
- Proactive Student Intervention: Automated alerts notify advisors when a student's attendance drops, allowing for immediate outreach to prevent withdrawal.
- Inter-Campus Benchmarking: Owners compare licensure pass rates between campuses to identify which teaching methods are most effective and share best practices across the organization.
- Optimizing Clinic Floor Profitability: Analyzing client service data helps schools identify their most profitable treatments and run promotions during historically slow periods.
- Fair and Objective Staff Evaluation: Leadership uses metrics like cohort graduation rates and student satisfaction scores to conduct objective performance reviews and identify top instructors for mentorship roles.
- Data-Driven Marketing Allocation: By tracking which lead sources produce the most successful students (i.e., those who graduate and pass their exams), schools can allocate their marketing budgets more effectively.
- Compliance Assurance: Real-time dashboards provide at-a-glance confirmation that all students are meeting their required theory and practical hours for state board and accreditation compliance.
- Improving Retail Training: Tracking product sales per student on the clinic floor highlights opportunities to provide additional retail and client communication training.
Frequently Asked Questions About Beauty School Metrics
What is the single most important KPI for a beauty school?
The State Board Licensure Pass Rate is arguably the most critical KPI. It is the ultimate validation of your curriculum's quality and your instructors' effectiveness, directly impacting your school's reputation and the success of your graduates.
How often should I review my school's performance metrics?
A tiered approach is best. Review operational metrics like attendance daily or weekly. Monitor leading indicators like student progress weekly or bi-weekly. Analyze lagging indicators like graduation and placement rates on a monthly and quarterly basis.
What's a good student retention rate for a beauty school?
While rates can vary, a strong benchmark to aim for is a retention rate of 80% or higher. Consistently achieving this level indicates a healthy, supportive student environment and an effective educational program that meets student expectations.
Can I just use off-the-shelf software for performance tracking?
Yes, many high-quality Student Information Systems (SIS) and school management software products are available. These are excellent for standardizing data. For schools with unique operational needs, a custom solution can offer more tailored tracking and reporting flexibility.
How do I track post-graduation job placement accurately?
Accurate tracking requires a multi-pronged approach. Use a combination of mandatory exit surveys, alumni email campaigns at 3, 6, and 12 months post-graduation, partnerships with local salons and spas, and tracking graduate career updates on professional networks like LinkedIn.
What's the difference between a leading and a lagging indicator?
A leading indicator is predictive, helping you forecast future outcomes. For example, low daily attendance (leading) can predict a future dropout (lagging). A lagging indicator reports on past results, such as the final graduation rate for a cohort.
How do I get my staff to buy into a data-driven culture?
Start by demonstrating how data makes their jobs easier, not harder. Frame it as a tool for student success and professional development, not punishment. Provide thorough training and celebrate wins that were achieved through data-driven insights.
Conclusion
Shifting your focus from surface-level numbers to the metrics that truly define educational quality is the most powerful strategic move a beauty school owner can make. By standardizing KPIs, leveraging technology for centralization, and analyzing the right data, you can transform your operations. This approach uncovers opportunities, mitigates risks before they escalate, and ensures every campus is operating at its full potential. The ultimate benefit is not just a healthier bottom line, but a stronger reputation built on a legacy of successful, licensed, and employed graduates.
As you move forward, the first step isn't to buy new software, but to perform a simple audit of your current data processes. Understanding where your information lives and how it's being used is the start of a successful journey toward clarity and control. Properly tracking beauty school performance is the definitive path to sustainable, scalable success in an increasingly competitive industry.
Related Articles


Ready to Transform Your Business?
Let's discuss how AI-powered automation can help you generate more leads and grow your business.
Book Your Free Strategy Call