
Your Business Data, Visualized Beautifully.
Custom BI dashboards that turn complex data into clear, actionable visualizations for faster, smarter decisions.
Everything You Need to Succeed
Comprehensive tools and systems designed to transform your business operations.
Custom Visualizations
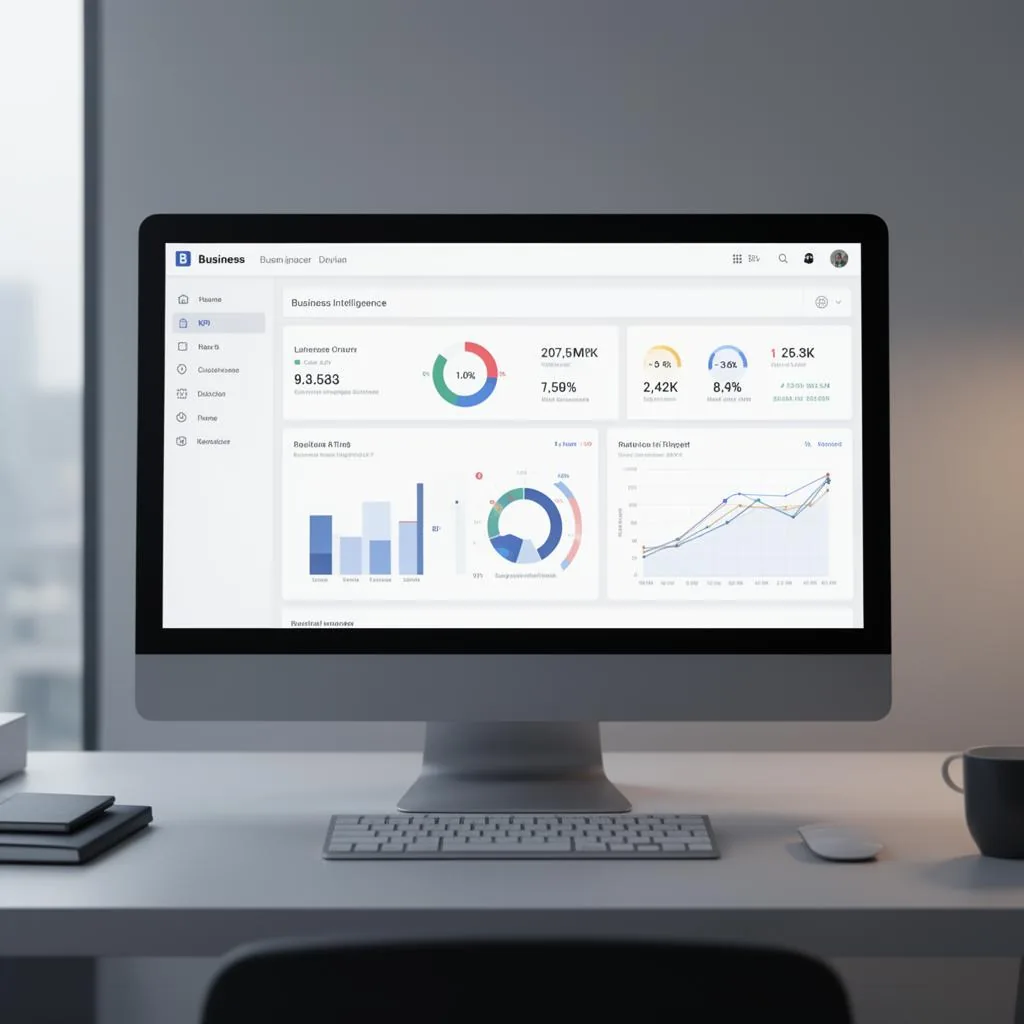
Charts, graphs, and dashboards tailored to your specific business metrics and KPIs.
Revenue Analytics
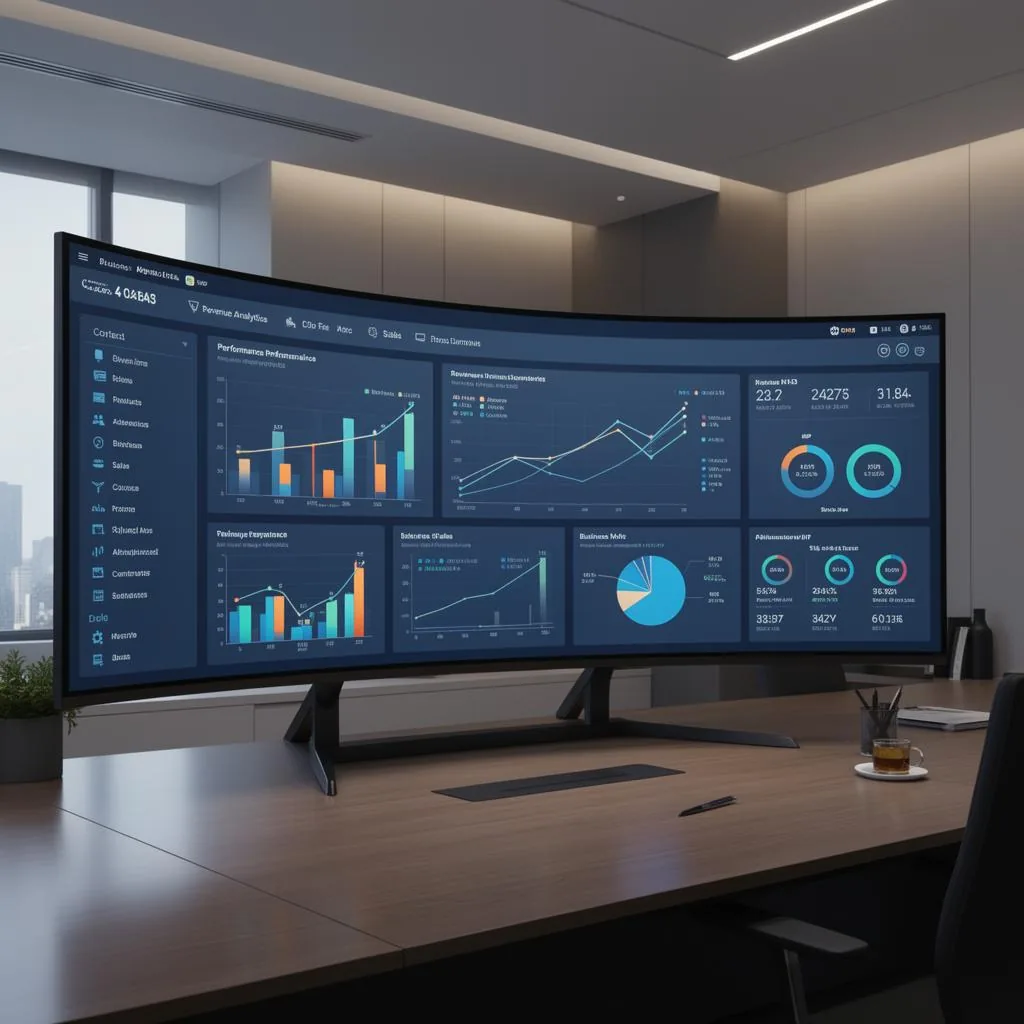
Track revenue by source, service, location, and time period with drill-down capabilities.
Performance Metrics
Monitor team, campaign, and operational performance in real-time.
Trend Analysis
Identify patterns and predict future performance with historical comparisons.
Segment Breakdowns
Slice data by customer type, geography, service line, or any dimension.
Real-Time Updates
Live data feeds that keep your dashboards current without manual refresh.
Results That Speak for Themselves
Our clients see measurable improvements within the first 30 days.
Benefits That Drive Growth
We become your strategic partner, handling the complexity so you can focus on growth.
See Everything That Matters
All your critical metrics in one place, updated in real-time.
Make Faster Decisions
Clear visualizations help you understand data and act quickly.
Identify Opportunities
Spot trends and patterns that reveal growth opportunities.
Track Progress Toward Goals
Visual goal tracking keeps you focused on what matters.
Impress Stakeholders
Professional dashboards for investors, partners, and board meetings.
How We Work Together
A proven approach that delivers measurable results.
Define Metrics
We identify the KPIs that matter most for your business decisions.
Connect Data
We integrate all your data sources into a unified platform.
Build Dashboards
We create intuitive visualizations that make data actionable.
Frequently Asked Questions
What data sources can you connect?+
We connect CRMs, ad platforms, accounting software, phone systems, and virtually any tool with data export or API capabilities.
How often does data update?+
Most dashboards update in real-time or every 15-30 minutes depending on data source capabilities.
Can I access dashboards on mobile?+
Yes, all dashboards are mobile-responsive and accessible from any device.
Do you provide training?+
Absolutely. We train your team on reading and using the dashboards effectively.
Ready for Custom BI Dashboards?
Let's build dashboards that make your data actionable.